
Wind power is one of the fastest growing sources of power in the world, because of the imperative to clean the air we breathe and the environment we live in. From bigger, more efficient turbines, to smart control systems and offshore solutions, the sector has proved fertile ground for innovation as technology has advanced. In such an environment, a patent landscape report serves as a tool to map out who is developing what and in what specific area and specific manner, which is useful for R&D, business strategy, and investment judgment.
This patent landscape report is designed to identify the trends and innovations in wind energy technology over the years. It will assist those such as researchers, investors, R&D personnel, trend players, policy-makers and companies to find the best and top players, trending segments, emerging growth areas and future demand across the world. It merges technical and strategic explorations involving patent filings, ownership analysis, jurisdictional reach, and technology categorization to offer a targeted perspective on the developments that will shape the future of wind power.
OBJECTIVE OF THE REPORT
This report provides us with an in-depth analysis on global patent activities related to wind energy for a period between the year 2020 and 2025. The aim is to uncover key innovation trends and spot technology and market gaps. The Patent data is supported by technical sources and industry reports for a detailed analysis.
Wind energy is at the forefront of the global transition to clean and reliable power. There is quickly growing innovation in turbines, materials, control systems, and storage. Filing patents has gone up tremendously, indicating substantial R&D and commercial interest globally. However, some critical breakthroughs are necessary to unlock its full potential.
It is also a transitioning energy system, creating economic opportunities. It quickly creates jobs, powers new industries, and cuts emissions. This report serves stakeholders in observing where innovation is happening and where it is not. The goal is simple: map the progress, reveal the gaps, and guide the next move.
METHODOLOGY
This report is based on a comprehensive analysis of patent data related to wind energy technologies from 2020 to 2025. Patent records were sourced mainly from Google Patents and the PatSeer database, forming a set of applications and granted patents. The study includes global filing environment with a concentration on jurisdictions actively engaged in wind-energy innovation.
The patent search strategy was developed using a combination of focused keywords such as “wind energy,” “Wind turbine,” “blade pitch control,” “wind energy storage,” “floating wind platform,” and “digital twin wind turbine.” To narrow down the results to the most relevant innovations, carefully constructed Boolean expressions combined with a set of IPC classifications F03D (wind motors), H02J (power distribution systems), G06F (data processing), and B63B (floating structures) were applied.
Patent families were grouped and duplicates were eliminated; this was done to ensure accuracy in trend mapping. Data were then filtered by applicant type, legal status, jurisdiction, and publication year. Key indicators such as top assignees, priority countries, and technology categories were extracted and analyzed. Visuals were created using various graphical representations to maintain consistency and readability across all parameters. Where necessary, our research has been cross-validated through industry reports, whitepapers, and technical literature for enhanced reliability and context.
This methodology ensures a structured, data-driven approach to understand the evolution of innovation in wind energy during the past decade, thus equipping both technical and strategic stakeholders with valuable insights.
SCOPE
This report provides a comprehensive analysis of wind energy patent activities between 2020 to 2025, with the following defined parameters:
- Geographical coverage : Global, with focused insights on key jurisdictions such as China, USA, Germany, Denmark, India, Japan, and others contributing significantly to wind energy innovation.
- Time period coverage: Patent filings from 2020 to 2025, capturing technological progress and shifts in R&D priorities.
- Patent family coverage : Analysis is based on priority patent families, covering:
- Active and granted patents,
- Pending applications,
- Expired patents for historical insight.
- Onshore and offshore wind turbines, Floating wind platforms,
- Turbine components (blades, towers, gearboxes, generators),
- Control systems (pitch, yaw, SCADA, AI-enabled),
- Grid integration and hybrid systems,
- Energy storage solutions (batteries, hydrogen)
- Sub-technology coverage:
- Blade material innovations (e.g., recyclable composites)
- Floating foundations and mooring systems
- Smart control and monitoring using IoT and digital twins
- Wind-solar hybrid models and microgrids
KEY TECHOLOGICAL AREAS
Wind energy technology today is not just about building turbines, over time it has been evolved from being just turbines to a smarter, more technological connected system. This is clearly visible by the advancement in the digital twin technology which creates a virtual replica of a turbine to simulate real time operational conditions, monitor wear and tear, and optimizes the performance. For example, Siemens Gamesa is working with NVIDIA to develop AI-powered digital twins for its wind turbines.
Alongside there is AI-driven predictive maintenance tools which are used for machine learning to analyse sensor data. This helps in detecting faults, reducing downtime, operational expenses, increases safety and is cost effective. GE’s Predix platform uses machine learning to forecast failures and optimize maintenance schedules. It analyzes terabytes of sensor data across its wind fleets.
Floating wind platforms one of the major developments. It helps in enabling turbine development in deep waters beyond the reach of fixed fountains. Equinor’s Hywind Scotland, built the world’s first commercial floating wind farm and achieved a capacity factor of 54-57% in the first 5 years.
Finally, grid integration technologies include smart inverters and real-time load balancing. All together it shows one thing, that the wind energy technology is becoming more flexible and reliable day by day.
PARAMETER USED FOR THIS ANALYSIS
In this report, we shall study the following parameters:
- Patenting Trends for the year 2022 to 2025.
- Jurisdiction based Global Patent Filing Trends.
- Technology classification based on IPC classification.
- Activities of Competitors based on area of Research (IPC).
- Estimated top 10 industries and technology areas between 2020 and 2025.
- Estimated top 10 owners between 2020 and 2025.
- Estimated top 10 Assignee Countries between 2020 and 2025.
- Estimated top 10 priority countries between 2020 and 2025.
- Estimated top 10 publication countries between 2020 and 2025.
- Distribution of Patents based on their current legal status.
A. Patenting Trends for the year 2020 to 2025
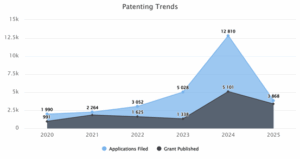
Figure 1: Patenting Trends for the year 2020 to 2025
Figure 1 shows the distribution of patents in wind energy technology from 2020 till 2025. This includes applications filed and grants published. The maximum number of patent applications had been filed in 2024, with figures touching 12,810 filings, followed by 2025, with 3,868 filings. In the case of grants, it was 2024 again when their highest peak was published: 5,101 grants were published, while the lowest number of grants, 991, was in 2020. Up till 2024, patent filings had sharply risen for wind energy, thus depicting a very strong surge of innovation during this period.
B. Jurisdiction based Global Patent Filing Trends
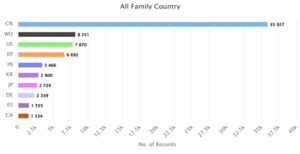
Figure 2: Jurisdiction based Global Patent Filing Trends
Figure 2 shows the global patent filing trends for wind energy technologies based on family country distribution. China leads by a significant margin with 35,927 records, followed by the World Intellectual Property Organization (WO) with 8,251 and the United States with 7,870. The European Patent Office (EP) follows closely with 6,692 records, while India ranks fifth with 3,466. The data reflects China’s dominant role in wind energy innovation, with strong activity also observed in major global and regional patent offices.
C. Technology classification based on IPC classification
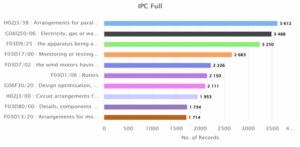
Figure 3: Technology classification based on IPC classification
Figure 3 represents the top IPC classifications by full code, showing specific areas of innovation in wind energy technologies. The most active category is H02J3/38, covering parallel power arrangements, with 3,612 records. This is followed by G06Q50/06 (utility service management) and F03D9/25 (apparatus for wind motors), with 3,488 and 3,250 records respectively. Other key areas include monitoring systems, rotor design, design optimization, and component arrangements, indicating a wide range of innovation focus across both hardware and system-level technologies.
D. Activities of Competitors based on area of research (IPC)
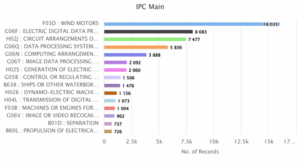
Figure 4: Activities of Competitors based on area of research (IPC)
Figure 4 represents the top IPC main classes associated with wind energy patents, showcasing broader technology categories. In which the dominant class being F03D, covering wind motors, with a significant lead of 16,035 records. Other major areas include electric data processing (G06F) with 8,083 records and circuit arrangements (H02J) with 7,477. The presence of data processing, control systems, and digital transmission categories reflects the growing integration of software, electronics, and automation in modern wind energy technologies.
E. Estimated top 10 industries and technology areas between 2020-2025
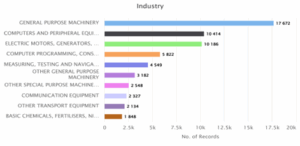
Figure 5.1: Top 10 industries
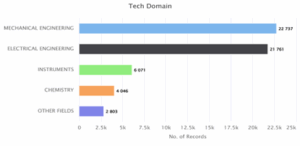
Figure 5.2: Top 5 technological areas
Figure 5.1 gives the number of records in various industries. The General-Purpose Machinery sector tops the list with 17,672 records, followed by Computers and Peripheral Equipment (10,414), and Electric Motors, Generators, and Transformers (10,186). Computer Programming, Consultancy, and Related Activities also contribute significantly with about 5,822 records. The Basic Chemicals and Fertilisers sector has the least, at 1,848. Overall, the data reflects a strong presence of machinery and technology-oriented industries in the record count.
Figure 5.2 illustrates the distribution of records across different technology domains. Mechanical Engineering leads with 22,737 records, followed closely by Electrical Engineering with 21,761, indicating their central role in innovation. Instruments (6,071) and Chemistry (4,046) also make notable contributions. Other Fields having smaller share with 2,803 records. The data highlights a strong concentration in core engineering areas, many of which are critical to advancing wind energy and other emerging technologies.
F. Estimated top 10 owners between 2020 and 2025
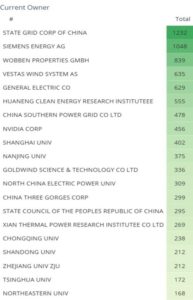
Figure 6: Estimated top 10 owners between 2020 and 2025
Figure 6 shows the top 20 current owners ranked by the total number of patents held by them. State Grid Corporation of China leads with 1,232 patents, followed by Siemens Energy AG with 1,048, and Wobben Properties GmbH with 839. Vestas Wind Systems and General Electric Co. round out the top five with 635 and 629 patents, respectively. The list includes both provate and public sectors such as corporate and academic institutions, reflecting wide-ranging innovation across the wind energy space.
G. Estimated top 10 Assignee Countries between 2020 and 2025
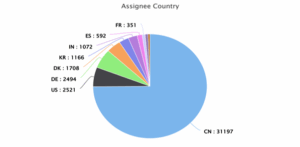
Figure 7: Estimated top 10 Assignee Countries between 2020 and 2025
Figure 7 presents the distribution of wind energy patent assignees by a country. Here again China dominates with about 31,197 assignees, showing its central role in global wind technology development. The United States (2,521), Germany (2,494), and Denmark (1,708) follow from far behind. Other notable contributors include South Korea, India, Spain, and France, underlining a global interest in wind energy innovation.
H. Estimated top 10 priority countries between 2020 and 2025
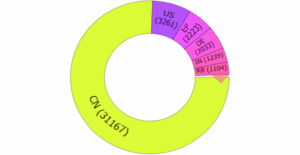
Figure 8: Estimated top 10 priority countries between 2020 and 2025
Figure 8 lists the top priority countries in wind energy patent applications/filings. China holds a commanding lead with 31,167 filings, showing strong domestic innovation and early-stage protection. The United States follows with 3,261, while the European Patent Office (EPO) at (2,223), Germany (2,033), India (1,239), and South Korea (1,104) also feature prominently. These numbers reflect where innovation is first registered and protected, before going onto an international expansion.
I. Estimated top 10 publication countries between 2020 and 2025
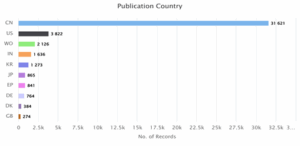
Figure 9: Estimated top 10 publication countries between 2020 and 2025
Figure 9 depicts the distribution of wind energy patents by publication country across the world. China being dominant again with a number of 31,621 published patents, far ahead of the United States at 3,822 and WIPO publications standing at 2,126, followed by India (1,636), South Korea (1,273), and Japan (865). The rest including EP, Germany, Denmark, and the UK have moderate numbers, reflecting broader international engagement but still way behind China’s pace.
J. Distribution of Patents based on their current legal status
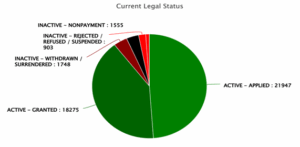
Figure 10:Distribution of Patents based on their current legal status
Figure 10 represents the current legal status of patents in wind energy. The majority fall under active applications (21,947) and active granted patents (18,275), together forming a dominant portion in the given data. In contrast, a smaller share includes inactive patents due to withdrawal or surrender (1,748), nonpayment (1,555), and rejection or suspension (903). This dominant share of active filings indicates ongoing innovation and commercial interest in the wind energy sector.
CONCLUSION
This report captures the rapid evolution of wind energy technologies over the past few years, highlighting the key trends in patent activity, innovation and global participation. The data reflects the growth in filings, especially from countries like China, the United States, Germany, Indian and Korea indicating both commercial interest and policy support for clean wind energy.
The technological advancements is not only on turbines alone, there is growing patent activity in areas such as grid integration, digital twin systems, AI-driven control, floating wind platforms, and hybrid energy solutions. These developments indicates that wind energy is moving beyond mechanical improvements and more toward smarter, more interconnected systems.
While a few major players still dominate the space, it’s encouraging to see more research institutions and new assignees entering the field. This broadening base of innovators opens the door for fresh partnerships, investments, and focused R&D efforts.
In short, the patent landscape report concludes that wind energy is not just scaling in capacity but also in its evolving complexity and capability. For stakeholders across all sectors, this report offers a strategic tool to track progress, identify gaps, and position themselves in a fast-moving global energy market.
Author: Ananya Ainapur , RV University, Bangalore
Please contact us at info@origiin.com to know more about our services (Patent, Trademark, Copyright, Contract, IP Licensing, M&A of companies)
Subscribe to YouTube Channel HERE
Join LinkedIn Group: Innovation & IPR
WhatsApp: +91 74838 06607


