 The growing global demand for clean and sustainable energy has driven significant interest in harnessing the power of the oceans. Sea energy, encompassing technologies such as wave energy, tidal energy, ocean thermal energy conversion (OTEC), and salinity gradient power, represents a promising frontier in renewable energy innovation. As countries and corporations invest in marine energy solutions, the patent landscape has become a critical indicator of technological advancements, competitive positioning, and commercialization potential.
Key Technologies of Sea Energy
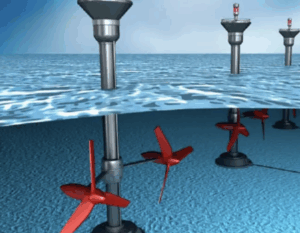
- Wave Energy Conversion (WEC) captures energy from ocean surface waves using devices like oscillating water columns, point absorbers, and attenuators. This technology dominates the marine energy patents and focuses on floating vs. fixed devices, power take-off (PTO) mechanisms, and wave farm optimization.
- Tidal energy extracts energy from tidal currents using underwater turbines (similar to wind turbines) or tidal barrages and uses this in innovations such as blade design, mooring systems, and subsea infrastructure.
- Ocean thermal energy conversion (OTEC) uses temperature differences between warm surface water and cold deep water to generate electricity. This technology has lower patent activity compared to wave/tidal but is growing in tropical regions.
- Salinity gradient power (Blue Energy) generates power from the difference in salt concentration between seawater and freshwater (e.g., using reverse electrodialysis or pressure-retarded osmosis). This is an emerging technology with niche patent filings.
- Offshore floating solar (Hybrid Systems) combines solar PV with floating platforms in calm sea regions. This technology overlaps with wave energy patents.
The report delves into the patent landscape of Sea energy, providing key insights into key players, technological trends and the competitive dynamics shaping the future of sea energy. By analyzing patent filings and grant trends, it aims to offer a comprehensive view of the intellectual property landscape that is driving the Sea energy forward.
OBJECTIVE OF PATENT LANDSCAPE
The objective of this patent landscape report for sea energy is to understand various trends with regard to patent activity in this space. The reports analyzed the patents filed, published and granted between 2014 and 2024. The search strategy used to generate data to prepare the report is based on a combination of predetermined International Patent Classification (IPC) codes, as well as specific keywords.
PARAMETERS USED FOR PATENT LANDSCAPE ANALYSIS
In this report, we studied the following parameters and trends:
- Patenting Trends for the year 2016 to 2024
- Distribution of Patents based on the Assignees
- Jurisdiction based Global Patent Filing Trends
- Technology classification based on IPC classification
- Activities of Competitors based on area of Research (IPC)
- Estimated top 10 industries and technology areas between 2014 and 2024
- Estimated top 10 owners between 2014 and 2024
- Estimated top 10 Assignee Countries between 2014 and 2024
- Estimated top 10 priority countries between 2014 and 2024
- Estimated top 10 publication countries between 2014 and 2024
A. PATENTING TRENDS BETWEEN THE YEAR 2014 TO 2024
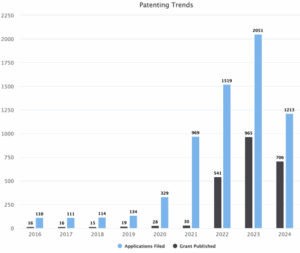
Figure 1: Sea Energy Patent filing trends between the years 2016 to 2024
Figure 1 depicts the distribution of patents for Sea energy between the years 2016 to 2024, including both applications filed and granted patents. The graph shows that the highest number of applications were filed in 2023 with 2051 patents followed by 2022 with 1519 patents and 2024 with 1213 patents. In the rest of the years i.e., 2021 is 969, 2020 is 329, 2019 is 134, 2018 is 114, 2017 is 111 and 2016 is 110. The highest number of patents granted in 2023 with 965 patents followed by 2024 with 706 patents and 2022 with 541. In the rest of the years i.e., 2021 is 30, 2020 is 28, 2019 is 19, 2018 is 15, 2017 is 16 and 2016 is 16. Overall, fillings for Sea energy patent families is gradually increased in the time period between 2016 and 2024.
B. DISTRIBUTION OF PATENTS BASED ON THE ASSIGNEES
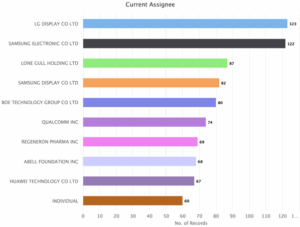
Figure 2: Sea Energy Distribution of patents based on the assignees
As indicated in Figure 2, LG Display CO LTD is the key player with 123 patents followed by Samsung Electronic CO LTD with 122. The next key players are Lone Gull Holding LTD with 87 Patents, Samsung Display CO LTD with 82 patents, Boe Technology Group CO LTD with 80 Patents, Qualcomm INC with 74 patents, Regeneron Pharms INC with 69 Patents, Abell Foundation INC with 68 patents, Huawei Technology CO LTD with 67 patents and individual with 60 patents.
C. JURISDICTION BASED GLOBAL PATENT FILING TRENDS
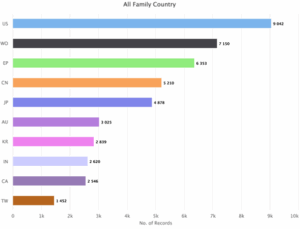
Figure 3: Sea Energy Distribution of patent based on the jurisdiction
Figure 3 shows the distribution of patents based on the jurisdiction. The maximum number of patents i.e., 9042 were filed in the US (United States) and rest of the patents were issued in the other jurisdictions, such as World Intellectual Property Organization (WO) with 7150 patents, European Patent Office (EP) with 6353 patents followed by China (CN) with 5210 patents, Japan (JP) with 4878 patents, Australia (AU) with 3025 patents, Korea (KR) with 2839 patents, India (IN) with 2620 patents, Canada (CA) with 2546 patents and Taiwan (TW) with 1452 patents.
D. TECHNOLOGY CLASSIFICATION BASED ON IPC CLASSIFICATION
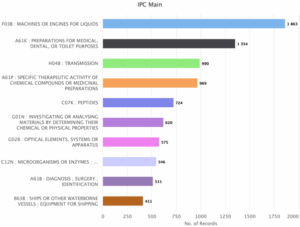
Figure 4: Sea Energy Patent Distribution based on main IPC Code Classification.
Figure 4 indicates the patent distribution based on the main IPC Code. The top spot is occupied by the Machines or Engines for Liquids with 1863 patent families. Other major players include Preparations for medical, dental, Toilet Purposes with 1354 patents; Transmission with 990 patents; Specific Therapeutic activity of chemical compounds or medicinal preparation with 969 patents; Peptides with 724 patents; Investigation or analyzing materials by determining their chemical or physical properties with 620 patents; optical elements, systems or apparatus with 575 patents; Microorganisms or Enzymes with 546 patents; Diagnosis, surgery identification with 511 patents and Ships or other waterborne vessels, equipment for shipping with 411 patents.
E. ACTIVITIES OF COMPETITORS BASED ON AREA OF RESEARCH (IPC)
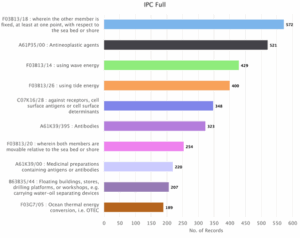
Figure 5: Sea Energy Distribution of Patent based on Competitors and Area of Research (IPC).
Figure 5 depicts the distribution of patents based on competitors and area of research (IPC). The top spot occupied by IPC F03B13/18 i.e., member is fixed at least at one point with respect to the sea or shore holds 572 patents. Other major players includes IPC A61P35/00 i.e., Antineoplastic agents with 521 patents, F03B13/14 i.e., Wave energy with 429 patents, F03B13/26 i.e., tide energy with 400 patents, C07K16/28 i.e., receptors, cell surface antigens or cell surface determinants with 348 patents, A61K39/395 i.e., Antibodies with 323 patents, F03B13/20 i.e., members are movable relative to the sea bed or shore with 254, A61K39/00 i.e., Medicinal preparations containing antigens or antibodies with 220 patents, B63B35/44 i.e., floating buildings, stores, drilling platforms, or workshops, e.g. carrying water-oil separating devices with 207 patents and F03G7/05 i.e., Ocean thermal energy conversion i.e., OTEC with 189 patents.
F. ESTIMATED TOP 10 INDUSTRIES AND TECHNOLOGY AREAS BETWEEN 2014 AND 2024
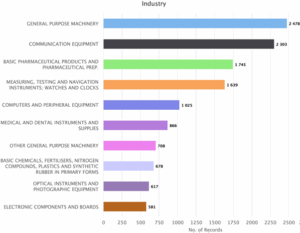
Figure 6: Sea Energy Distribution of Patent based on Industries & Technology.
Figure 6 indicates major industries and technology areas between 2014 and 2024. General purpose machinery is the main industry in the field with 2478 patents. Communication and Equipment follows next with 2303 patents. The next in line is Basic Pharmaceutical Products and Pharmaceutical Prep with 1745 patents, Measuring, testing and navigation instruments, watches and clocks with 1639 patents, Computers and peripheral equipment’s with 1025 patents, Medical and Dental Instruments and Supplies with 866 patents, Other general purpose machinery with 708 patents, Basic chemicals, Fertilizers, Nitrogen Compounds, Plastics and Synthetic Rubber in primary forms with 678 patents, Optical instruments and Photographic equipment with 617 patents and electronic components and boards with 581 patents.
G. ESTIMATED TOP 10 OWNERS BETWEEN 2014 AND 2024
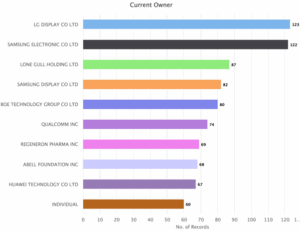
Figure 7: Sea Energy Distribution of Patent based on Current Owner.
As indicated in Figure 7, LG Display CO LTD is the major player with 123 patents followed by Samsung Electronic CO LTD with 122. The next key players are Lone Gull Holding LTD with 87 Patents, Samsung Display CO LTD with 82 patents, Boe Technology Group CO LTD with 80 Patents, Qualcomm INC with 74 patents, Regeneron Pharms INC with 69 Patents, Abell Foundation INC with 68 patents, Huawei Technology CO LTD with 67 patents and individual with 60 patents.
H. ESTIMATED TOP 10 ASSIGNEE COUNTRIES BETWEEN 2014 TO 2024
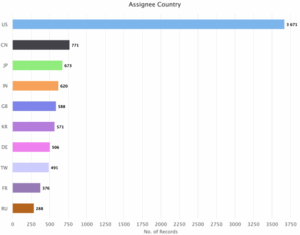
Figure 8: Sea Energy Distribution of Patent based on Assignee Countries.
Figure 8 indicates United states (US) is the key assignee country with 3671 patents followed by China (CN) with 771 patents, Japan (JP) with 673 patents, India (IN) with 620 patents, United Kingdom (GB) with 588 patents, Korea (KR) with 571 patents, Germany (DE) with 506 patents, Taiwan (TW) with 491 patents, France (FR) with 376 patents and Russia (RU) with 288 patents.
I. ESTIMATED TOP 10 PRIORITY COUNTRIES BETWEEN 2014 AND 2024
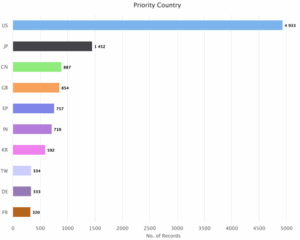
Figure 9: Sea Energy Distribution of Patent based on Priority Countries
As indicated in Figure 9, the United States (US) is the priority country for sea energy with 4933 patent family data set. Japan (JP) is another priority country with 1452 patents. Rest priority countries are China (CN) with 887 patents, United Kingdom (GB) with 854 patents, European Patent Organization (EP) with 757 patents, India (IN) with 710 patents, Korea (KR) with 592 patents, Taiwan (TW) with 334 patents, Germany (DE) with 333 patents and France (FR) with 320 patents.
J. ESTIMATED TOP 10 PUBLICATION COUNTRIES BETWEEN 2014 AND 2024
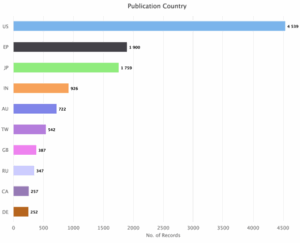
Figure 10: Sea Energy Distribution of Patents based on Publication Countries.
Figure 10 indicates that the maximum patents belong to the investors of United States (US) with 4539 patents and rest patents are issued to the investors of other countries, i.e., European Patent Organization (EP) with 1900 patents, Japan (JP) with 1759 patents, India (IN) with 926 patents, Australia (AU) with 722 patents, Taiwan (TW) with 542 patents, United Kingdom (GB) with 387 patents, Russia (RU) with 347 patents, Canada (CA) with 257 patents and Germany (DE) with 252 patents.
CONCLUSION
The patent landscape analysis for sea energy technologies from 2014 to 2024 reveals a rapidly evolving sector driven by global demand for sustainable energy solutions. The exponential growth in patent filings, particularly peaking in 2023 with over 2,000 applications, underscores intensified research and commercialization efforts in wave, tidal, and ocean thermal energy conversion (OTEC) systems. Leading corporations like LG Display and Samsung Electronics dominate the patent landscape, reflecting cross-industry interest in marine energy applications, while jurisdictions such as the U.S., China, and Japan emerge as key innovation hubs. Notably, fixed marine energy systems and wave energy technologies receive the most attention, whereas OTEC remains relatively underdeveloped, signaling potential growth opportunities. The unexpected overlap with pharmaceutical and electronics patents suggests interdisciplinary advancements, possibly in biofouling-resistant materials or smart energy systems. As governments and industries prioritize decarbonization, this report emphasizes the critical role of strategic IP protection, international collaboration, and targeted R&D investments to accelerate the commercialization of sea energy technologies and unlock their full potential in the global renewable energy transition.
Author: Dashami B.M., PES University, Bangalore
Please contact us at info@origiin.com to know more about our services (Patent, Trademark, Copyright, Contract, IP Licensing, M&A of companies)
Subscribe to YouTube Channel HERE
Join LinkedIn Group: Innovation & IPR
WhatsApp: +91 74838 06607


