A. Introduction
Augmented Reality Technology (AR) displays a transformative leap in the way of interaction with the digital and physical platforms. By overlaying the computer-generated images, sounds and sensory enhancements onto our everyday real surroundings, AR bridges the gap between the virtual and real by creating a mixed-reality experience thereby enhancing the user’s way of perceiving and interaction.
AR Technology integrates digital information with the user’s environment in the real-time. AR overlays digital content onto our physical world even through devices such as smartphones, tablets, AR glasses etc., unlike Virtual Reality (VR) which immerses the users in a completely different kind of virtual world. The scope of AR extends across various domains like gaming, education, healthcare, manufacturing and navigation etc.
Key components of AR technology include:
- Sensors and Cameras, which captures the physical surroundings and tracks the user movements.
- Processors which handles the computational load which is required to integrate and display augmented content in the real-time world.
- Displays which projects the augmented content onto the user’s view, ranging from simple screens to the advanced displays.
- Software Algorithms which facilitates the interaction between the digital and physical realms through object recognition, tracking and the rendering techniques.
AR Technology has penetrated various sectors thereby offering new ways to enhance the user experiences. In healthcare, AR assists in medical training and complex operations while in retail, it enables virtual try-ons and interactive advertisements. In education, it brings subjects to life by using interactive learning modules whereas in the gaming industry, the success of games like Pokémon GO showcases AR’s potential to revolutionize entertainment.
The rapid growth of AR Technology is reflected in the increasing number of the filings of patents. Patents in this domain encompass hardware innovations, software advancements, user interface designs and specific application techniques. Leading technology companies such as Apple, Google, Microsoft and emerging startups are heavily investing in the AR-related R&D thereby resulting in a very competitive patent landscape.
This report delves into the patent landscape of AR technology, providing key insights into key players, technological trends and the competitive dynamics shaping the future of augmented reality. By analyzing patent filings and grant trends, it aims to offer a comprehensive view of the intellectual property landscape that is driving the AR industry forward.
- Objective of Patent Landscape
We, at Origiin, prepared this Patent Landscape Report for AR Technology to understand various trends with regard to patent activity in this space. We have analyzed the patents filed, published and granted between 2022 and 2024. The search strategy used to generate the data to prepare the report is based on a combination of predetermined International Patent Classification (IPC) codes, as well as specific keywords.
We observed that the companies based in the India, United States and World Intellectual Property Organization are the major contributors of patent filings in the area of AR Technology. The leading patent filing companies include the Chandigarh University , Chitkara University and RV University.
C. Parameters used for Patent Landscape analysis
In this report, we studied the following parameters and trends:
- Patenting Trends for the year 2022 to 2024
- Distribution of Patents based on the Assignees
- Jurisdiction based Global Patent Filing Trends
- Technology classification based on IPC classification
- Activities of Competitors based on area of Research (IPC)
- Estimated top 10 industries and technology areas between 2022 and 2024
- Estimated top 10 owners between 2022 and 2024
- Estimated top 10 Assignee Countries between 2022 and 2024
- Estimated top 10 priority countries between 2022 and 2024
- Estimated top 10 publication countries between 2022 and 2024
D. Patent filing trend between years 2022 to 2024
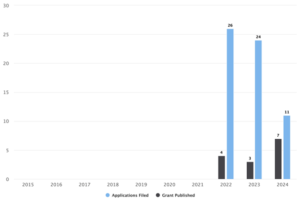
Figure 1: Patent filing trend between the years 2022 to 2024
The Figure 1 depicts the distribution of patents for AR Technology between the years 2022 to 2024, including both applications filed and granted patents. The graph shows that highest number of applications were filed in 2022 with 26 patents followed by 2023 with 24 patents. However, the lowest number of patents were granted in the year 2023 with 03 patents compared to 2022 with 04 patents and 2024 with 07 patents. Overall, filings for AR Technology patent families is gradually increased in the time period between 2022 and 2024.
E. Distribution of Patents based on the Assignees
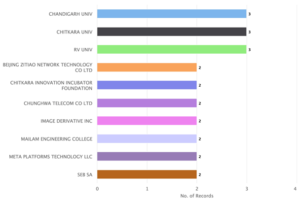
Figure 2: Distribution of Patents based on the Assignees
As indicated in Figure 2, Chandigarh University is the key player with 03 patents along with Chitkara University and RV University each. The next key players are Beijing Zitiao Network Technology Company Ltd., Chitkara Innovation Incubator Foundation, Chunghwa Telecom Company Ltd., Image Derivative Inc, Mailam Engineering College, Meta Platforms Technology LLC and Seb S.A who holds 02 patents each.
F. Jurisdiction based Global Patent Filing Trends
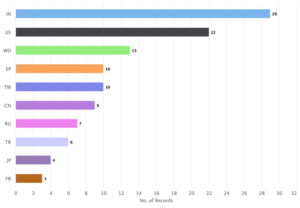
Figure 3: Distribution of Patent based on the jurisdiction
The Figure 3 shows the distribution of patents based on the jurisdiction. The maximum number of patents, i.e, 29, were filed in the IN (India) and rest of the patents were issued in the other jurisdictions, such as, United States (US) with 22 patents, World Intellectual Property Organization (WO) with 13 patents followed by European Patent Office (EP) with 10 patents and Taiwan (TW) with 10 patents, China (CN) with 09 patents, Russia(RU) with 07 patents, Turkey (TR) with 06, Japan (JP) with 04 patents and France (FR) with 03 patents.
G. Technology classification based on IPC classification
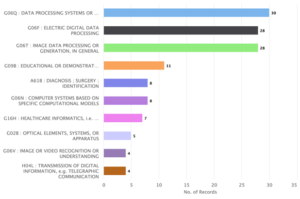
Figure 4: AR Technology Patent Distribution based on main IPC Code Classification
The Figure 4 indicates the patent distribution based on main IPC code. The top spot is occupied by the data processing systems or methods, specially adapted for administrative, commercial, financial, managerial, supervisory or forecasting purposes with 30 patents families. Other major players include Electric digital data processing and Image data processing or generation, in general with 28 patent families each followed by educational or demonstration appliances; appliances for teaching, or communicating with, the blind, deaf or mute; models; planetaria; globes; maps; diagrams with 11 patent families. Diagnosis: surgery: identification follows along with Computer systems based on specific computational models with 08 patents each while the next in line i.e., Healthcare Informatics hold 07 patents and Optical elements, systems or apparatus hold 05 patents. Image or video recognition or understanding and Transmission of digital information hold 04 patents each.
H. Activities of Competitors based on Area of Research (IPC)
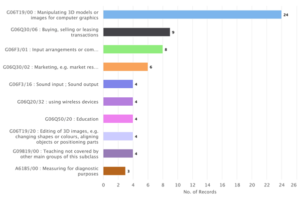
Figure 5: Augmented Reality Technology (AR) Distribution of Patent based on Competitors and Area of Research (IPC)
The Figure 5 depicts the distribution of patents based on competitors and area of research (IPC). The top spot occupied by IPC G06T19/00 i.e, manipulating 3D models for images for computer graphics holds 24 patents. Other major players includes G06Q30/06 i.e, buying, selling or leasing transactions with 09 patent families and input arrangements or combined input and output arrangements for interaction between user and computer with 08 patent families. IPC G06Q30/02 for marketing with 06 patent families. Sound input: Sound output, using wireless devices, education, editing of 3D images and teaching not covered by other main groups of this subclass with 04 patents each. IPC A61B5/00 Measuring for diagnostic purposes holds 03 patents.
I. Estimated top 10 Industries and Technology areas between 2022 and 2024
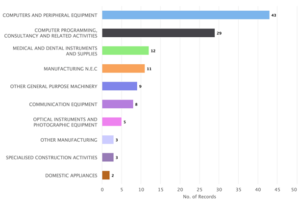
Figure 6: Augmented Reality Technology (AR) Distribution of Patent based on Industries & Technology.
The Figure 6 indicates major industries and technology areas between 2022 and 2024. Computers and Peripheral Equipment is the major industry in the field. Computer Programming, Consultancy and Related Activities follows next with 29 patents. The next in line is Medical and Dental Instruments and Supplies with 12 patents. The Manufacturing N.E.C Industry holds 11 patents while the Other General Purpose Machinery has 09 patents. The Communication Equipment has 08 patents followed by Optical Instruments and Photographic Equipment with 05 patents. Other Manufacturing and Specialised Construction Activities holds 03 patents each. The least in number is the Domestic Appliances with 02 patents.
J. Estimated top 10 Owners between 2022 and 2024
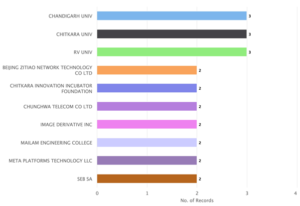
Figure 7: AR Technology Distribution of Patent based on Current Owner
As indicated in Figure 7, Chandigarh University is the major player with 03 patents along with Chitkara University and RV University each. The next key players are Beijing Zitiao Network Technology Company Ltd., Chitkara Innovation Incubator Foundation, Chunghwa Telecom Company Ltd., Image Derivative Inc, Mailam Engineering College, Meta Platforms Technology LLC and Seb S.A who holds 02 patents each.
K. Estimated top 10 Assignee Countries between 2022 and 2024
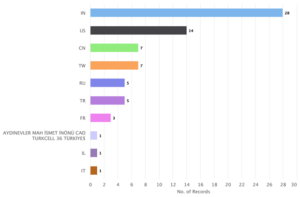
Figure 8: Distribution of Patent based on Assignee Countries
The Figure 8 indicates India (IN) is the key assignee country with 28 patents followed by United States (US) with 14 patents, China (CN) and Taiwan (TW) with 07 patents each, Russia (RU) and Turkey (TR) with 05 patents each, while France (FR) with 03 patents. The lowest include Turkcell Technology Arastirma ve Gelistirme A.S (TR), Israel (IL) and Italy (IT) with 01 patents each.
L. Estimated top 10 Priority Countries between 2022 and 2024
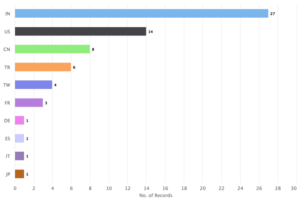
Figure 9: Distribution of Patent based on Priority Countries
As indicated in Figure 9, India (IN) is the priority country for the AR with 27 patent family data set. United States (US) is another priority country with 14 patents. Rest priority countries are China (CN) with 08 patents, Turkey (TR) with 06 patents, Taiwan (TW) with 04 patents and France (FR) with 03 patents. The lower half priority country include Germany (DE), Spain (ES), Italy (IT) and Japan (JP) with 01 patents each.
M. Estimated top 10 Publication Countries between 2022 and 2024
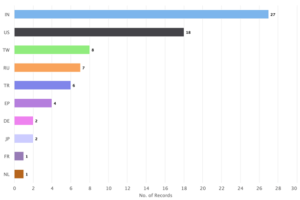
Figure 10: Augmented Reality Technology (AR) Distribution based on Publication Countries
The Figure 10 indicates that the maximum patents belongs to the inventors of India (IN) with 27 patents and rest patents are issued to the inventors of other countries, ie United States (US) with 18 patents, Taiwan (TW) with 08 patents, Russia (RU) with 07 patents, Turkey (TR) with 06 patents followed by European Patent Office (EP) with 04 patents, Germany (DE) and Japan (JP) with 02 patents each, and the least i.e, France (FR) and Netherlands (NL) with 01 patents each.
N. Analysis of ECG Suppliers
Analysis was performed in order to obtain the companies involved in Augmented Reality Technology. The list of companies involved in AR Technology comprises the companies from various parts of the world involved in AR production and the irrespective patents and publications. The companies have been mentioned in the analysis of the graphical representation of patent applications under each parameter used for patent landscape analysis.
Apart from the companies list, there are few universities involved in AR Technology (AR) production:
- Chandigarh University (Punjab)
- Chitkara University (Punjab)
- RV University (Bengaluru)
- Mailam Engineering College (Tamil Nadu)
O. Conclusion
Augmented Reality Technology (AR), one of the most popular industrial instruments widely used in gaming and entertainment, health care, retail and e-commerce, education and training, manufacturing and maintenance, real estate and architecture, navigation, tourism, advertising and marketing, military and defense and automotive industry etc., has opened up new dimensions and vistas for diagnosis on an industrial scale. The study indicates that the substantial number of patents is filed by inventors of the IN (India) and Chandigarh University (Punjab) being the major player. The study also shows that there are very less patents filed when it comes to manufacturing industries when compared to computers and peripheral equipment. This sector is of growing interest as the amount of patenting activity has increased. The data shows that there are maximum published patent families related to the AR Technology worldwide, of which 29 are from IN (India) applicants. Based on the list of top applicants, it is clear the leading patent filers include the Chandigarh University, Chitkara University and RV University.
Authors: Ansh Kanaujia & Meghana Chowdary, Alliance University
Please contact us at info@origiin.com to know more about our services (Patent, Trademark, Copyright, Contract, IP Licensing, M&A of companies)
Subscribe to YouTube Channel HERE
Join LinkedIn Group: Innovation & IPR
WhatsApp: +91 74838 06607


