Introduction
Over the decade, the fast development of wearable technology and smart electronic materials led to significance global emergence. Smart wearables represent garments and textile fabrics embedded with sensors, conductive yarns, microelectronic components, and stimuli-responsive materials, nanoconductor technology, etc can monitor physiological signals, adapt to environmental conditions, and enable real-time data transmission. Such as heartbeat, sense body movement, react to heat or cold, and even send data to your phone or computer, all from the fabric itself. This technology is now being used in hospitals, sports training, defence, factory safety gear, and everyday fashion.
Key Technologies of Wearable Smart Textile Technologies
Signal Transmission Textiles capture electrical signals using textile bands with zigzag conductive yarns stretched by elastic threads. This technology dominates the smart textile patents and focuses on preventing damage from tensile force, motion sensing capabilities, and health monitoring applications.
Security Sensors extract object detection using NFC transmitters/receivers embedded in pocket sides combined with EMG sensors in sleeves. This technology uses innovations such as signal strength detection, hand movement tracking, and theft alert systems.
Touch Sensing Fabrics use special effects (piezoelectric, piezoresistive, optical, electromyographic) to enable interactive device control. This technology has growing patent activity and focuses on device surfaces, touch interfaces, and responsive clothing.
Nanoconductor Technology generates circuits on the scale of single threads (nano-scale width less than 150 micrometers) integrated with clothing. This is an emerging technology with niche patent filings enabling configurable electronic functions.
Adaptive Fabrics change textile density based on activities, events, or temperature using Electroactive Polymers (EAP). This technology overlaps with health and comfort patents.
Smart Cleaning Systems use RFID tags on textile articles to automatically identify cleaning instructions for machines.
The report examines patent landscape of Wearable Smart Textile Technologies (2015–2025), providing key insights into leading applicants, technological trends and the competitive dynamics shaping the future of smart textiles. By analyzing patent filings and grant trends, it aims to offer a comprehensive view of the intellectual property landscape that is driving wearable smart textile technologies forward.
OBJECTIVE OF PATENT LANDSCAPE
The main aim of this patent landscape report is to undertake an exhaustive analysis of the patent filed and issued between 2015-2025 concerning wearable smart textiles. This patent landscape report provides insight into the trends of technology development, competition, and innovations in the emerging sector through patent filings, publications as well as great analyses. This study will be based on patent filings that have been obtained through international sources based on IPC classification, CPC classification, and specific terms for smart textiles, wearable electronic devices, and textile sensors.
By conducting such an approach will enable all concerned stakeholder which include business leaders, scientists, researcher, technologists and the textile industry will be able to get insights on IP landscape, can find out who the leaders are in market, innovation of whitespaces , and research and development investment strategies for the emerging technologies decide whether to invest in R&D.
PARAMETERS USED FOR PATENT LANDSCAPE ANALYSIS
In this comprehensive report, we analyzed the following key parameters and trends to provide a holistic view of the wearable smart textile patent landscape:
- Patenting Trends for the years 2015 to 2025
- Distribution of Patents based on the Assignees
- Jurisdiction-based Global Patent Filing Trends
- Technology Classification based on IPC/CPC Classification
- Activities of Competitors based on Area of Research (IPC)
- Estimated top 10 industries and technology areas between 2015 and 2025
- Estimated top 10 patent owners between 2015 and 2025
- Estimated top 10 Assignee Countries between 2015 and 2025
- Estimated top 10 priority countries between 2015 and 2025
- Estimated top 10 publication countries between 2015 and 2025
1. Patenting Trends for the years 2015 to 2025
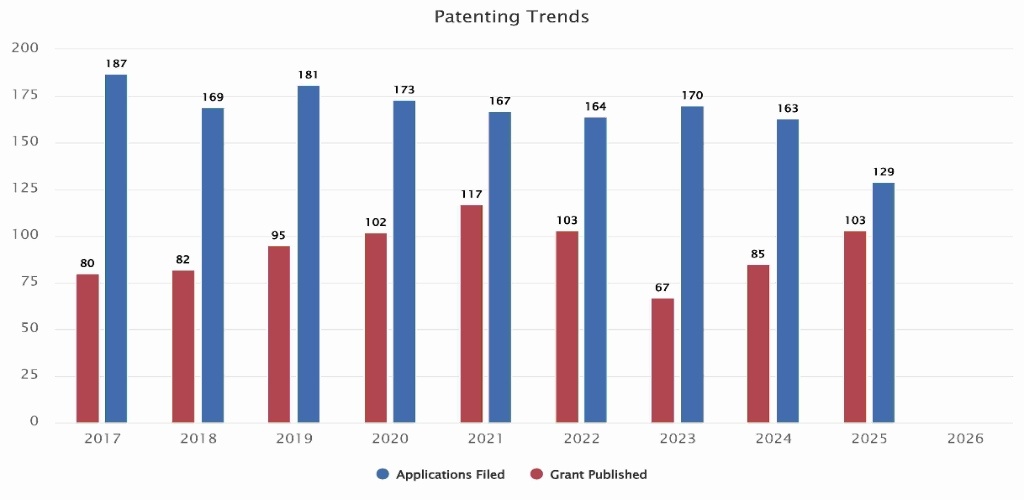
Figure 1: Smart Fabric Patent Trends (2015–2025)
Figure 1 Shows the figures of the number of patent applications and approvals from 2017 to 2025. During 2017 to 2018, the industry performed very well by filing patents between 169 to 187 and granting patents were between 80 and 82. From 2019 to 2021, the number of patent applications decreased from 181 to 167; however, granted patents jumped significantly to reach the maximum level of 117. From 2022 to 2024, there is stability in applications between 163 and 170, but approvals decreased to 67 during 2023 and reached 85 in 2024. Finally, during 2025, the number of applications was reduced to a lowest level of 129, whereas granted patents increased to 103. In total, from 2017 to 2025, there have been 1,503 applications filed and 834 patents approved, indicating a good success rate of 55%.
2. Distribution of Patents based on the Assignees
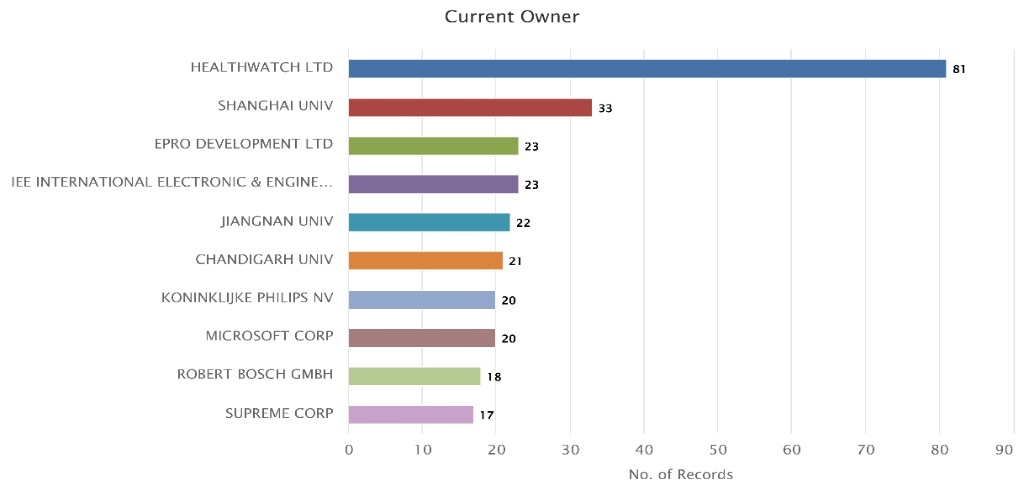
Figure 2 : Distribution of Patents based on the Assignees (2015-2025)
Figure 2: Shows the estimated top 10 industries and technological fields from 2015 to 2025. First, the market is dominated by the medical and manufacturing industries, starting from Medical and Dental Instruments with 780 patent records, then Other Special Purpose Machinery with 559 records. Secondly, there are competitive consumer and analytical fields, consisting of Wearing Apparel with 402, Measuring, Testing and Navigation with 314, Textiles with 302, and Computers and Peripheral Equipment with 256 patent records. Thirdly, the infrastructure and materials science occupy the bottom position in the top 10 category, namely Communication Equipment with 248, Electronic Components and Boards with 245, Wiring and Wiring Devices with 176, and Basic Chemicals, Fertilisers, Nitrogen with 169 patent records. In all, there are 3,451 patent records among these top 10 categories, while the top two industries take more than 38% of the whole innovative activities. Therefore, it could be stated that the industry as a whole is deeply rooted in advanced healthcare technologies and special machinery development.
3. Jurisdiction-based Global Patent Filing Trends
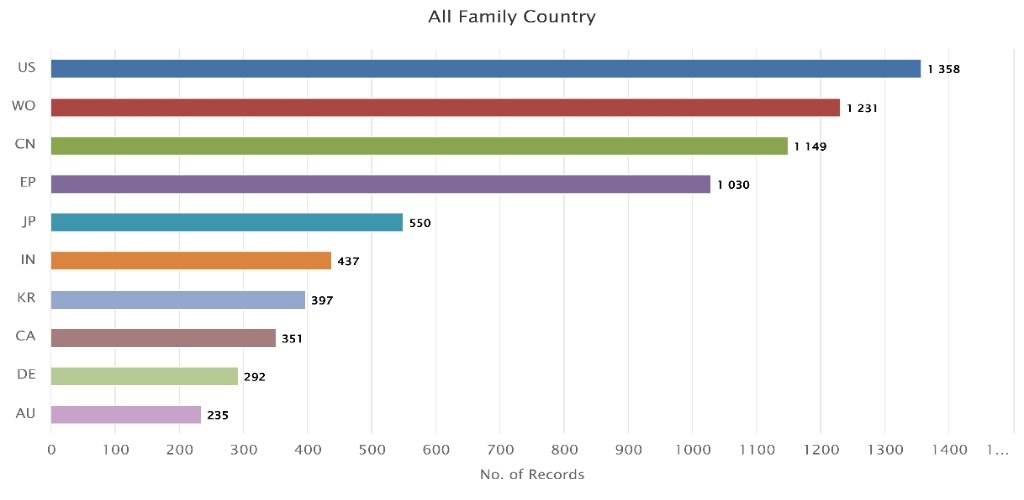
Figure 3: Jurisdiction-based Distribution of wearable textile patents (2015-2025)
Figure3 : It provides an overview of the global trends in patents filed on the basis of jurisdiction. First of all, US dominates the global patent scene with a record high of 1,358, followed by WIPO (WO) at 1,231 and China (CN) at 1,149. After that, European Patent Office (EP) holds a good rank with 1,030 records, followed by a mid-level category of countries where Japan (JP) occupies 550 records, India (IN) occupies 437, South Korea (KR) occupies 397 and Canada (CA) occupies 351. Finally, Germany (DE) and Australia (AU) occupy the tenth and ninth place with 292 and 235 records, respectively. In sum, total 7,030 patent records are accounted among these top ten jurisdictions, where top four premier patent offices hold more than 68% of the total patent filings.
4. Technology Classification based on IPC Classification
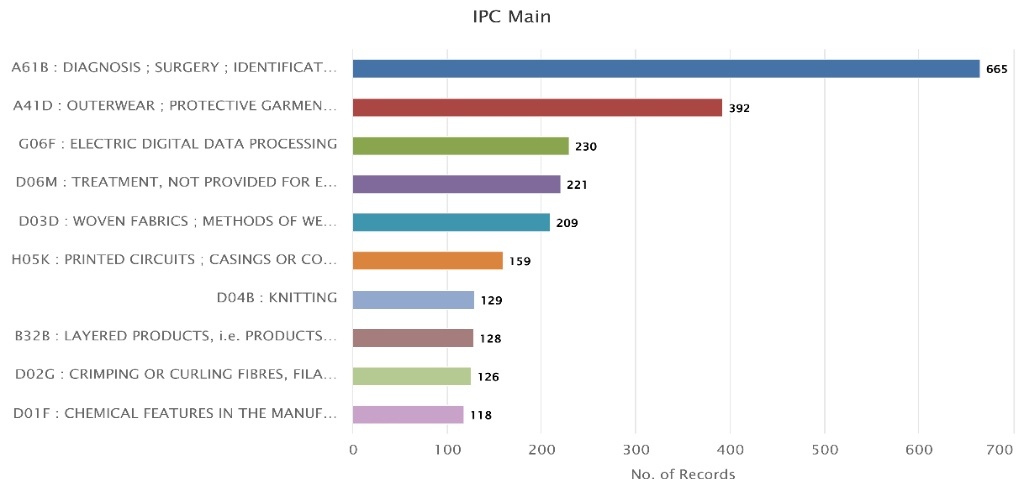
Figure 4: Patent Distribution based on IPC Code Classification
Figure 4: Shows an example of how to classify the technologies in the sector using the IPC Main. First of all, the industry is dominated by medical diagnostics and clothing with A61B (Diagnosis; Surgery; Identification) dominating with a huge 665 patent records while A41D (Outerwear; Protective Garments) takes the second position with 392 records. Afterward, the third level is formed by data processing and material treatments, where G06F (Electric Digital Data Processing) leads with 230 records followed by D06M (Treatment, Not Provided for Elsewhere) with 221 records, D03D (Woven Fabrics; Methods of Weaving) with 209 records, and H05K (Printed Circuits; Casings) with 159 records. In the final group, other textile and manufacturing classifications are stable at the bottom level including D04B (Knitting) with 129 records, B32B (Layered Products) with 128 records, D02G (Crimping or Curling Fibres) with 126 records, and D01F (Chemical Features in the Manufacture) with 118 records. Therefore, a total of 2,397 patent records are shared by the top ten technologies above, where two healthcare and garment categories represent over 44% of the sector focus. As a result, it may be suggested that the sector is highly concentrated on the integration of modern medical diagnostics and special protective clothing.
5. Activities of Competitors based on Area of Research (IPC)
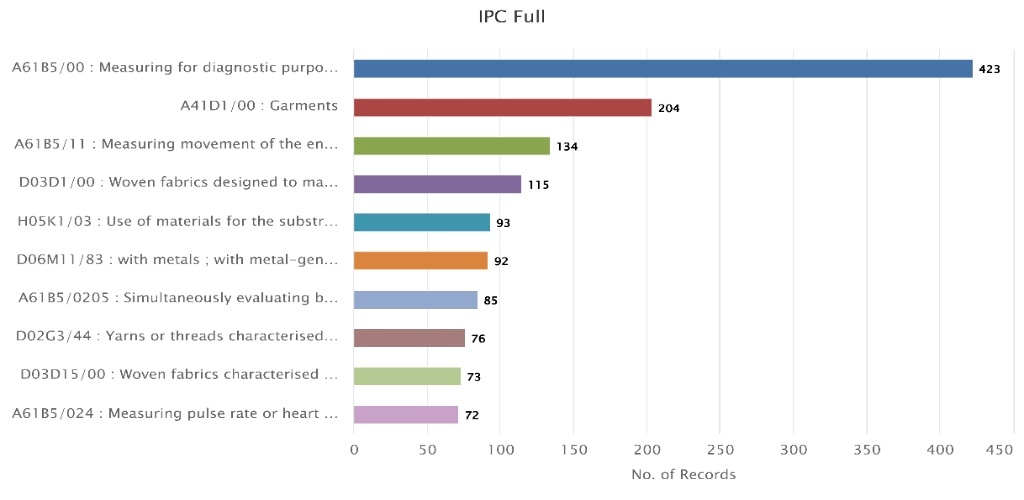 Figure 5: Competitive Activities Based on Research Areas and IPC Classification
Figure 5: Describes the competitive actions from the perspective of particular fields of study (IPC Full). At first, there is a very strong domination of medical diagnostics and general apparel, including A61B5/00 (Measuring for diagnostic purposes), which is significantly ahead with 423 patent entries, as well as A41D1/00 (Garments) with 204 entries. Further, there are physiological monitoring and fabric manufacturing as a competitive middle level represented by A61B5/11 (Body movement measurement) with 134 entries, D03D1/00 (Specialized woven fabrics) with 115 entries, H05K1/03 (Substrate materials) with 93 entries, and D06M11/83 (Metal-treated fibers) with 92 entries. Finally, more sophisticated subfields become steady at the bottom of the list such as A61B5/0205 (Simultaneous parameter evaluation) with 85 entries, D02G3/44 (Specialized yarns) with 76 entries, D03D15/00 (Material-specific woven fabrics) with 73 entries, and A61B5/024 (Pulse or heart rate measurement) with 72 entries. In total, the number of patent entries within the top ten fields of study is 1,367, and almost 46% of all innovations are represented by medical diagnostics and primary garments. Therefore, it can be stated that research is still greatly focused on the connection
6. Estimated top 10 industries and technology areas between 2015 and 2025
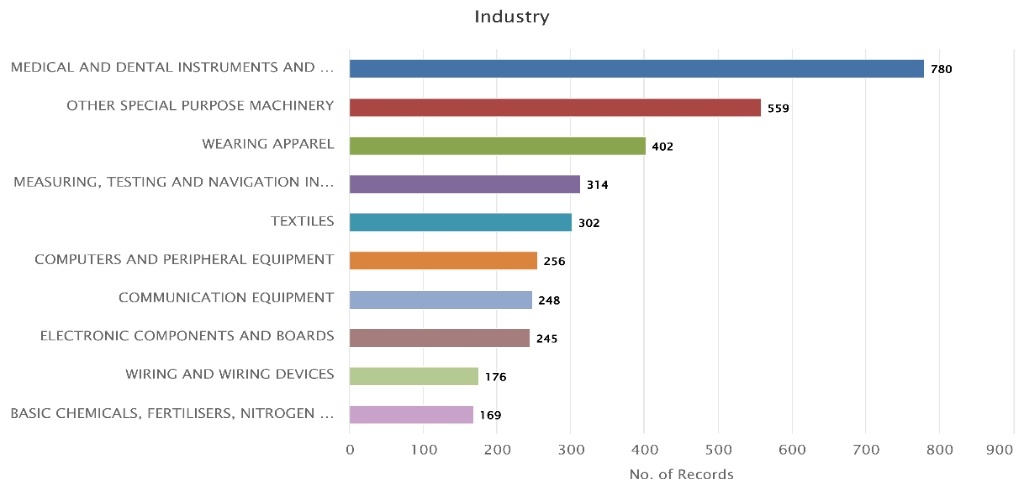
Figure F: Top Industries and Technology Areas in Wearable Smart Textiles (2015-2025)
Figure F: Shows the estimated top 10 industries and technological fields from 2015 to 2025. First, the market is dominated by the medical and manufacturing industries, starting from Medical and Dental Instruments with 780 patent records, then Other Special Purpose Machinery with 559 records. Secondly, there are competitive consumer and analytical fields, consisting of Wearing Apparel with 402, Measuring, Testing and Navigation with 314, Textiles with 302, and Computers and Peripheral Equipment with 256 patent records. Thirdly, the infrastructure and materials science occupy the bottom position in the top 10 category, namely Communication Equipment with 248, Electronic Components and Boards with 245, Wiring and Wiring Devices with 176, and Basic Chemicals, Fertilisers, Nitrogen with 169 patent records. In all, there are 3,451 patent records among these top 10 categories, while the top two industries take more than 38% of the whole innovative activities. Therefore, it could be stated that the industry as a whole is deeply rooted in advanced healthcare technologies and special machinery development.
7. Estimated top 10 patent owners between 2015 and 2025
Figure 7: Distribution of Patent based on current owners (2015-2025)
Figure 7: Shows the estimated top 10 industries and technological fields from 2015 to 2025. First, the market is dominated by the medical and manufacturing industries, starting from Medical and Dental Instruments with 780 patent records, then Other Special Purpose Machinery with 559 records. Secondly, there are competitive consumer and analytical fields, consisting of Wearing Apparel with 402, Measuring, Testing and Navigation with 314, Textiles with 302, and Computers and Peripheral Equipment with 256 patent records. Thirdly, the infrastructure and materials science occupy the bottom position in the top 10 category, namely Communication Equipment with 248, Electronic Components and Boards with 245, Wiring and Wiring Devices with 176, and Basic Chemicals, Fertilisers, Nitrogen with 169 patent records. In all, there are 3,451 patent records among these top 10 categories, while the top two industries take more than 38% of the whole innovative activities. Therefore, it could be stated that the industry as a whole is deeply rooted in advanced healthcare technologies and special machinery development.
8. Estimated top 10 Assignee Countries between 2015 and 2025
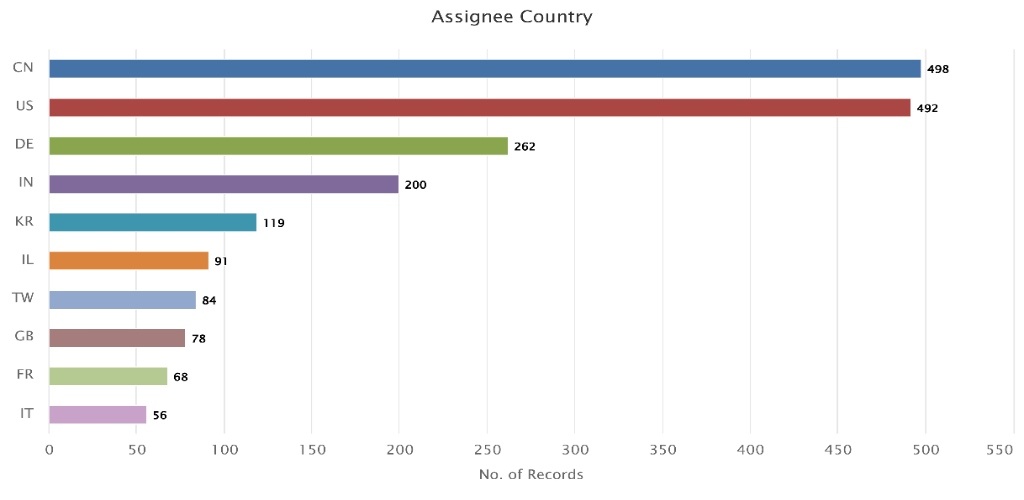
Figure 8: Distribution of Patent based on Assignee Countries
Figure 8 : Shows the estimated top 10 assignee countries from 2015 to 2025. First, the industry is characterized by a clear duopoly, which includes China (CN) with 498 patent records and the United States (US) with 492 records. Second, there is a competitive mid-tier of the manufacturing and technology hubs, which include Germany (DE) with 262 records, India (IN) with 200 records, and South Korea (KR) with 119 records. Lastly, there is an innovation hub in the lower part of the top tier, which comprises Israel (IL) with 91 records, Taiwan (TW) with 84 records, the United Kingdom (GB) with 78 records, France (FR) with 68 records, and Italy (IT) with 56 records. In total, the top ten countries include 1,948 patent records. Furthermore, China and the United States together own more than 50% of the whole industry share. Therefore, it could be said that while innovations are taking place in many different developed and developing economies, the industry is consolidated in the hands of the USA and China.
9. Estimated top 10 priority countries between 2015 and 2025
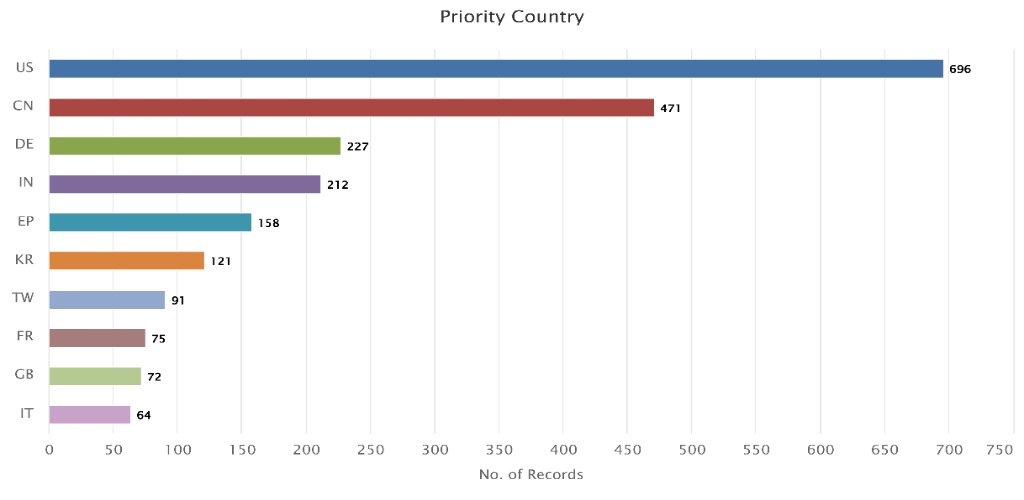
Figure 9: Distribution of Patents based on Priority Countries
Figure 9: Shows the estimate of the top 10 priority countries from 2015 to 2025. First, the international market is dominated largely by the United States (US) taking the lead with a high number of 696 patent entries, followed closely by China (CN) which ranks as the second largest with 471 entries. In succession, the competing intermediate innovative regions include Germany (DE) with 227, India (IN) with 212, European Patent Office (EP) with 158, and South Korea (KR) with 121 entries. Finally, the rest of the international technology centers rank in the lower top tier with Taiwan (TW) with 91, France (FR) with 75, United Kingdom (GB) with 72, and Italy (IT) with 64 entries. All in all, there are 2,187 entries among these top 10 countries in total. The United States and China together account for more than 53% of the whole sector share. In conclusion, one might argue that even though international collaboration occurs actively, the intention of first filing is mainly focused on the markets of the United States and China.
10. Estimated top 10 publication countries between 2015 and 2025
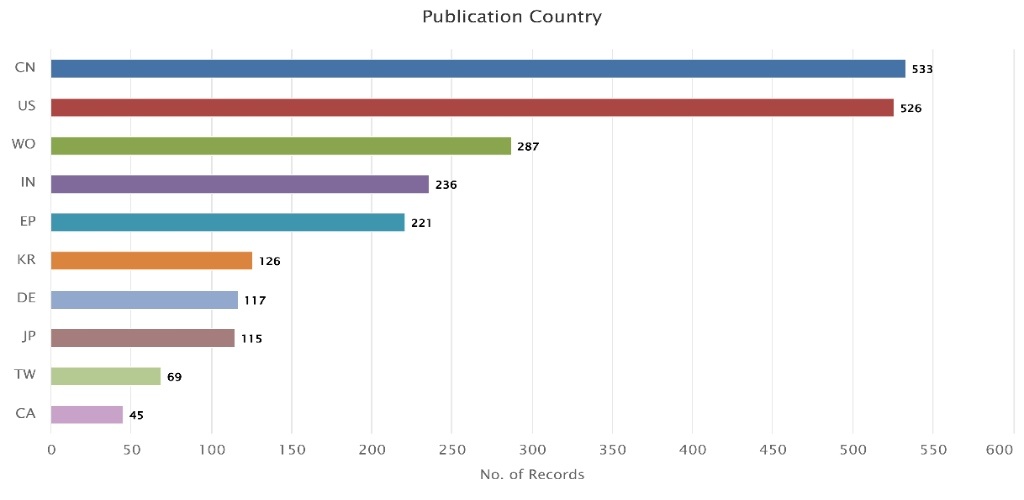
Figure 10: Distribution of Patents based on publication
Figure 10: It shows that the world scenario is characterized by a strong duopoly between China (CN) leading with 533 patents and the United States (US) with 526 patents. After this, there is a competitive middle tier where regional and international publications of patents are led by WIPO (WO) with 287, India (IN) with 236, and European Patent Office (EP) with 221 patents. Finally, the rest of global innovation markets settle for the bottom top tier where South Korea (KR) leads with 126, Germany (DE) with 117, Japan (JP) with 115, Taiwan (TW) with 69, and Canada (CA) with 45 patents. In sum, 2,275 patents have been spread among the top 10 countries in the world scenario, with a combined market share of more than 46% from China and the US together. Therefore, it is clear that while patent publications are geographically dispersed, their global market is heavily concentrated under Chinese and American patents.
CONCLUSION
The time period from 2015 to 2025 has been a transformative age for the global textiles industry, whereby the adoption of wearable smart textiles has become widely recognized with a successful 55% patent rate (834 patents granted out of 1,503 patent filings) [Figure 1]. The steady growth of patents, which had remained constant from 2017 to 2024 but was now shifting towards market consolidation in 2025, is strongly driven by the health care and manufacturing industries, especially by Medical and Dental Instruments (780) and Other Special Purpose Machinery (559) sectors [Figure F].
There is evidence of significant concentration of intellectual property rights among the leading participants of the industry in question, whereby the top 10 technological and industrial areas account for a total of 3,451 patent cases, with the top 2 industrial sectors accounting for 38% of the total innovation activities [Figure F/Figure 7]. Such concentration gives rise to certain legal issues in terms of patent thickets, possible anticompetitive practices, and opportunities for niche inventions from the rest 62% of the technology space [Figure F/Figure 7]. The United States is leading globally in terms of patent filings with a record high of 1,358 patents, followed by WIPO international applications that account for 1,231 patents and China with 1,149 patents [Figure 3].
The four important categories of technologies that promote innovation within industries through the IPC Main include diagnostic techniques (A61B: 665 patent publications), outerwear (A41D: 392 patent publications), electronic data processing (G06F: 230 patent publications), and fabric treating (D06M: 221 patent publications) [See Figure 4]. This convergence creates intricate intellectual property issues, particularly as data processing and diagnostic capabilities merge with modern fabric technology.
Indeed, this is an excellent example for legal students to analyze in connection with the issues of product liability, data privacy and convergence of technologies. The interconnection between health care diagnostic apparel (A61B) and innovative outerwear (A41D) highlights the critical necessity to learn about data privacy systems, international legislation on medical devices, and liability issues [see Figure 4]. In the future, as these technologies progress, legal professionals will have to consider systemic issues related to the failure of sensors, patent infringement through material treatment, and privacy issues built right into the security sensors and signal transmission textiles.
Disclaimer
The patent landscape report on Wearable Smart Textile Technologies is based on publicly accessible sources that include patent applications and patents freely available, accessible, or downloadable from public, commercial, and governmental patent databases unless stated otherwise. In addition, the report makes use of the accuracy of the respective patent office and patent registry records. In this regard, the author will not be responsible for any mistakes, omissions, inaccuracies, or misfiled data included or not included in these records. In this connection, it should be emphasized that the data provided in the databases is not necessarily regularly updated. It also should be pointed out that the analysis, observations, and conclusions drawn in the report were made according to the expert’s personal opinion and professional considerations and can vary from one expert to another.
Research Credit
This patent landscape report was prepared by Ms. Priya Dutta, Summer Intern at ORIGIIN IP Solutions LLP and a student of Sister Nivedita University, under the guidance and review of the ORIGIIN IP team.
Need a Custom Patent Landscape for Your Technology?
Patent landscape reports help businesses identify innovation trends, monitor competitor activity, uncover technology white spaces, and make informed R&D and IP decisions. Whether you are evaluating a new technology, entering a new market, or planning your patent filing strategy, a customised patent landscape can provide valuable business intelligence.
ORIGIIN IP Solutions LLP assists startups, research institutions, universities, and enterprises with tailored patent landscape analyses, technology scouting, prior art searches, and IP strategy services.
👉 Learn how our patent intelligence services can support your innovation journey:
https://origiin.com/contact-us/